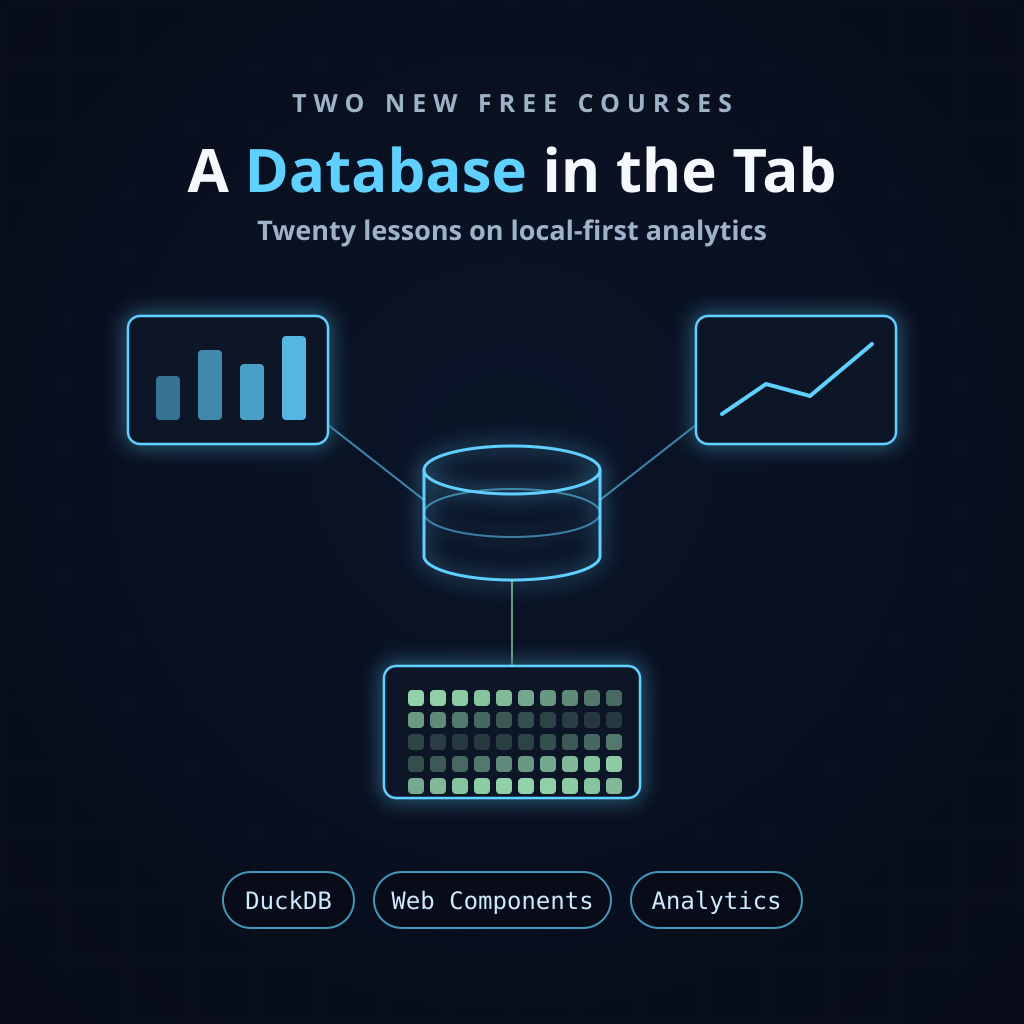
Two more free courses are live, and they are two halves of one codebase: SQL in the Browser builds the data layer, and A Reactive Dashboard builds the interface on top of it. Twenty lessons, no signup, no paywall, and a companion repository whose git history is the curriculum.
Why put a database in the browser
There is a version of “no backend” that means someone else’s backend — a
/api/summary endpoint returning numbers that were already chewed for you.
This is the other one.
DuckDB is a columnar analytical engine, the kind that lives behind a dashboard, and it compiles to WebAssembly. Once it is in the tab, the queries you would normally send over a network run against data the browser already holds. Filtering stops being a request and becomes a keystroke. Twenty thousand rows, a seven-day moving average, a month-by-item pivot — single-digit milliseconds, no server involved.
The cost is honest and stated in lesson 1: the engine is a 34 MB wasm binary, about 7.7 MB gzipped, cached after the first visit. Whether that trade is worth it depends entirely on what you do afterwards, and you cannot judge it until you have seen what it buys.
Part one: the engine
Nine lessons that never render a component. You boot DuckDB, move your own
marshalling code into a worker behind a typed Comlink contract, seed twenty
thousand rows, and put the database in an OPFS file so the second visit costs
nothing. Then the SQL that earns the engine: prepared statements with a
variable-length IN clause, pagination that stays constant no matter what is
filtered, AVG(SUM(amount)) OVER (…) for a trailing average in one pass, and
PIVOT.
It ends with a query console you built yourself — free-form SQL, DuckDB’s parser
errors shown verbatim, and EXPLAIN ANALYZE on anything you type.
The interface for all of that is a textarea and an unstyled table, deliberately. Nine lessons is not enough to teach a database engine and build a dashboard, and pretending otherwise is how tutorials end up teaching neither.
Part two: the dashboard
Eleven lessons that open by deleting fifty lines of working code — the plain query surface part one ended on — and never touch the database again. Not one line of the worker or the query functions is edited.
What replaces it: a store made of TC39 signals, a query runner built on
Signal.subtle.Watcher that debounces bursts and drops stale results, and
twelve Lit components that subscribe to data by reading it. A filter dropdown
built on the Popover API with no open state and no document listener. A
dual-handle date slider. D3 charts inside shadow roots. And then, one lesson
later, a calendar heatmap with no charting library at all — a hundred and eighty
cells of CSS grid and color-mix(), containing zero SVG elements.
Those two lessons sit back to back on purpose. D3 earns its place when you need scales and interpolated transitions; it is dead weight when you need a grid of coloured squares. Most dashboards are heavier than they need to be because the first chart justified the dependency and everything after it inherited the decision.
The last lesson is the entire design system in one diff: oklch tokens,
light-dark(), and a registered --hue property that lets one slider recolour
the whole application in both themes.
What “verified” means here
Every lesson ends at an annotated tag — engine-01 through engine-09, then
ui-01 through ui-11 — and consecutive tags diff to exactly one lesson’s
work, between two and nine files. That diff is the answer key.
All twenty tags build and typecheck from a clean npm ci, checked in a fresh
clone rather than in the directory they were authored in. Every stage was also
driven in a real browser: the debounce claim is eight rapid clicks producing
exactly one query, measured; the moving average was checked against the mean of
the first seven days by hand; every pivot row reconciles against the per-item
totals.
Writing them that way killed a claim I had already put in the plan. The standard
reason for moving a database into a web worker is that the engine would
otherwise block the main thread — and for DuckDB that is false before you start,
because AsyncDuckDB constructs itself around its own worker. What is still on
your main thread is your code: SQL assembly, Arrow decoding, row mapping, a
twenty-thousand-row insert. Lesson 2 moves that, and you end up with two workers
and a reason to know why. The same pass turned a missing aria-expanded on the
filter dropdown into that lesson’s challenge instead of a feature I claimed the
code had.
Where to start
Take part one if you want to know what an
analytical engine in a browser actually costs and what it can do. Take
part two if you already have data and want
the interface — clone the companion repo at engine-09 and you are exactly
where its first lesson begins.
Both are on the courses page with the other free ones. If you want the test suite they deliberately ship without, Testing the Untestable is the paid follow-up — real browsers, real wasm, real workers, and the fake-timer tests that pin down the query runner.